Walker's DOT explained why WI roads, budgets are in poor shape
Summer driving update, Wisconsin-style.
For your 'Why Wisconsin's roads are awful to drive on,' or 'Scottholes' files - -
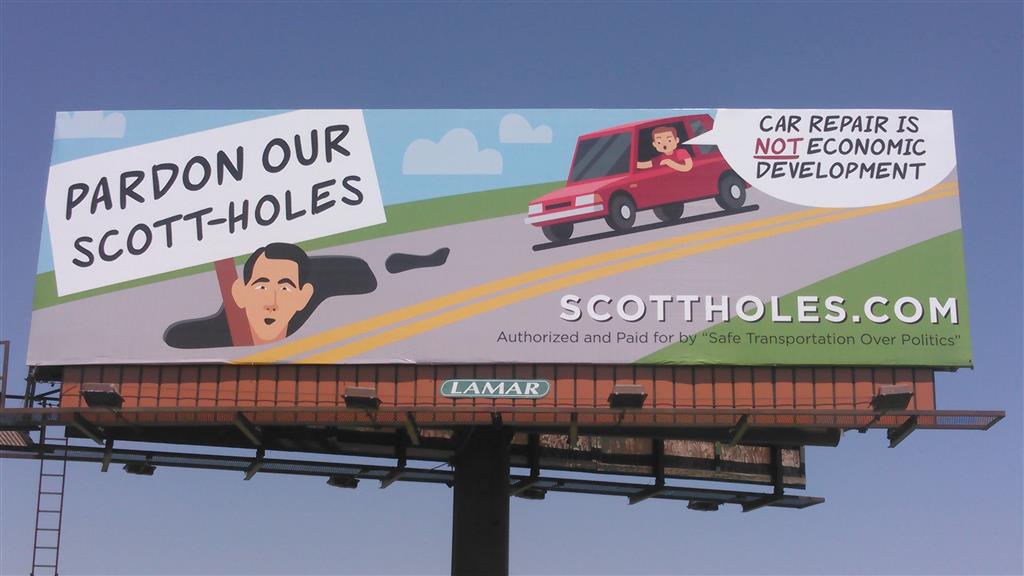 - - here are a few highlights from a 2017 comprehensive state audit of Wisconsin highways, roads, spending and management, below. I recall read-out the report but somehow missed the full text, until stumbling on it today.
The italicizing below is mine. I finally stopped reading and copying because I couldn't take it anymore. Let's just say when it comes to the condition of our roads, Wisconsin DOT and state auditors had given us all the answers.
* Page 4: The proportion of state highways rated in good condition decreased steadily from 53.5 percent in 2010 to 41.0 percent in 2015, according to DOT’s pavement condition index, which is used to determine pavement deterioration. The condition of state highways can be measured in multiple ways. According to the international roughness index, which measures highway smoothness, the proportion of state highways in good condition in Wisconsin was considerably lower than in six other midwestern states in 2014...
We also analyzed 16 major highway projects ongoing in August 2016. The cost estimates reported by DOT in August 2016 for these 16 projects had increased by an estimated $3.1 billion since DOT had provided the cost estimates at enumeration.
* Page 5: We found that DOT budgeted to complete more major highway project work than could be completed with its available funding. It did so because it did not sufficiently take into account the effects of inflation and unexpected cost increases on project expenditures. DOT indicated that unexpected cost increases caused delays in project work that it had planned to complete.
For your 'Why Wisconsin's roads are awful to drive on,' or 'Scottholes' files - -
- - here are a few highlights from a 2017 comprehensive state audit of Wisconsin highways, roads, spending and management, below. I recall read-out the report but somehow missed the full text, until stumbling on it today.The italicizing below is mine. I finally stopped reading and copying because I couldn't take it anymore. Let's just say when it comes to the condition of our roads, Wisconsin DOT and state auditors had given us all the answers.
* Page 4: The proportion of state highways rated in good condition decreased steadily from 53.5 percent in 2010 to 41.0 percent in 2015, according to DOT’s pavement condition index, which is used to determine pavement deterioration. The condition of state highways can be measured in multiple ways. According to the international roughness index, which measures highway smoothness, the proportion of state highways in good condition in Wisconsin was considerably lower than in six other midwestern states in 2014...
We also analyzed 16 major highway projects ongoing in August 2016. The cost estimates reported by DOT in August 2016 for these 16 projects had increased by an estimated $3.1 billion since DOT had provided the cost estimates at enumeration.
* Page 5: We found that DOT budgeted to complete more major highway project work than could be completed with its available funding. It did so because it did not sufficiently take into account the effects of inflation and unexpected cost increases on project expenditures. DOT indicated that unexpected cost increases caused delays in project work that it had planned to complete.
DOT determines which rehabilitation projects to construct. DOT’s data indicate that these projects typically do not expand existing highways. We found that DOT has not changed the proportions of funds allocated among its five regions to complete certain rehabilitation projects since 2006, did not fully comply with administrative rules for selecting projects, and did not document why it selected particular projects to construct over other potential projects.
* Page 27:...the proportion of non-backbone state highways rated in good condition by the pavement condition index decreased steadily from 51.5 percent in 2010 to 35.9 percent in 2015, while the proportion rated in poor or worse condition increased steadily from 7.5 percent in 2010 to 22.0 percent in 2015. DOT indicated that it spent a decreasing proportion of rehabilitation program funds on non-backbone highways in recent years in order to prioritize projects on backbone highways.
Page 33: DOT provided us with completed evaluations for the 11 [major] projects that it had suggested to the Transportation Projects Commission from 2002 through 2014. We reviewed the information and found that DOT complied with its rules for numerically evaluating the five potential projects that it had suggested to the Transportation Projects Commission in 2002.
We found that DOT did not fully comply with its rules for numerically evaluating the remaining six potential major highway projects. When determining a score for community input, DOT’s rules require that half of the score be based on public support for, or opposition to, a potential project, as determined through informational hearings and correspondence, and that the other half be based on a potential project’s consistency with current metropolitan, local, or regional transportation plans. The information DOT provided indicated that DOT did not take public opinion into account when determining the community input scores for the six potential projects suggested to the Transportation Projects Commission in 2010 and 2014 but instead based the scores entirely on metropolitan, local, or regional transportation plans. DOT indicated that it took public opinion into account by holding public meetings required by federal and state environmental laws, but it did not use public opinion to determine community input scores.
*Page 34:
*Page 34:
- As a result, we examined 19 projects. To capture all project expenditures, we defined a project to be completed after DOT had incurred all expenditures, which was typically years after project construction had ended.
We found that DOT’s cost estimates at enumeration were incomplete.
We note that 13 of the 19 projects took 18 years or more for DOT to incur all expenditures, and the effects of inflation on project expenditures can be significant over time. Nevertheless, none of the cost estimates for the 19 projects took into account that inflation would increase project costs over time, although cost estimates for all 19 projects indicated that inflation was excluded from them.
In addition, DOT indicated that its cost estimates for projects enumerated before 2011 typically excluded design engineering, construction engineering, and certain other project-related costs.
We also found that DOT’s information on project expenditures was not consistently complete. DOT indicated that it was unable to readily identify some expenditures made before 2001, when it implemented a new electronic financial system. We identified $40.9 million in project expenditures that DOT had not identified.
Then I read some more:
*Page 103
As shown in Figure 18, Wisconsin’s maintenance expenditures of $8,075 per lane mile of state highways were lower than those of six other midwestern states in 2014, which was the most-recent year for which such information existed at the time of our audit. The information on which this comparison is based must be viewed with caution because states may not consistently define maintenance work.
In report 97-4, we had found that Wisconsin’s maintenance expenditures per lane mile of state highways were lower than five of these six other midwestern states.And there are these examples which say it all:
*Appendix 8
Reasons that Cost Estimates Increased after Enumeration for Five Ongoing Major Highway Projects
We reviewed the reasons for cost increases other than inflation on five ongoing projects for which DOT expects final costs to be considerably higher than the estimates provided at enumeration.
We reviewed the reasons for cost increases other than inflation on five ongoing projects for which DOT expects final costs to be considerably higher than the estimates provided at enumeration.
I-39/90 (Madison to Illinois) Project
Enumerated in 2011, this project’s estimated cost increased from $715.0 million at enumeration to $1.2 billion in August 2016, or by $485.9 million. DOT indicated that the cost estimate increased for a number of reasons other than inflation, including:
- DOT completed additional design engineering and construction work and purchased additional real estate. This increased the cost estimate by $113.6 million.
- FHWA required DOT to increase the scope of the interchange with I-43. This increased the cost estimate by $50.0 million.
- DOT modified its policies to include in the cost estimate the cost of design engineering and construction engineering completed by DOT staff. This increased the cost estimate by $39.3 million.
- DOT upgraded alternate routes and increased shoulder width to minimize traffic delays and accidents. This increased the cost estimate by $38.5 million.
- When forecasting future traffic levels as part of the project planning process in 2008, DOT used traffic counts that were six years old. When DOT updated its forecast in 2012, using traffic counts from that year, it concluded that the project required an increased pavement thickness and eight lanes, instead of six, to accommodate the higher forecast of future traffic levels near Janesville. These changes increased the cost estimate by $35.0 million.
- DOT identified additional utilities costs, such as for relocating electrical wires. This increased the cost estimate by $17.5 million.
USH 18/151 (Verona Road) Project
Enumerated in 2011, this project’s estimated cost increased from $150.0 million at enumeration to $279.7 million in August 2016, or by $129.7 million. DOT indicated that the cost estimate increased for a number of reasons other than inflation, including:
- DOT policies required additional types of costs, such as design engineering and construction engineering, to be included in the estimated cost when this project was transferred from the rehabilitation program to the major highway program. This increased the cost estimate by $56.8 million.
- When forecasting future traffic levels as part of the project planning process in 2011, DOT used traffic counts that were five years old. When DOT updated its forecast of future traffic levels in 2012, using traffic counts from that year, it determined that it needed to construct additional highway lanes and a more-expensive interchange. This increased the cost estimate by
$28.4 million. - DOT purchased additional real estate and underestimated the cost of real estate acquisition. This increased the cost estimate by $10.1 million.
![]()


2 comments:
And yet Walker continued to care more about sucking up to Grover Norquist's "no tax" pledge than in improving the infrastructure that Wisconsinites depend on.
It tells you all you ever needed to know about who that guy worked for as governor, and who he speaks for today.
I find Scott Walker's new podcast to be refreshing and enlightening. Thank you, Scott Walker, for telling it like it is.
Post a Comment